Lists were a big addition to Excel 2003 as they allowed you to work with list data in Excel more easily than ever before. One key plus was that they let you create charts that expanded automatically as the data in the list grew. This was something you simply couldn’t do before very easily.
Now in Excel 2007 lists are called tables and they are simple to create using the Format As Table option on the Home tab on the Ribbon. One gotcha is that you shouldn’t use a table format if you don’t want to create a list, instead use the much more cumbersome and much less pretty Cell Styles options.
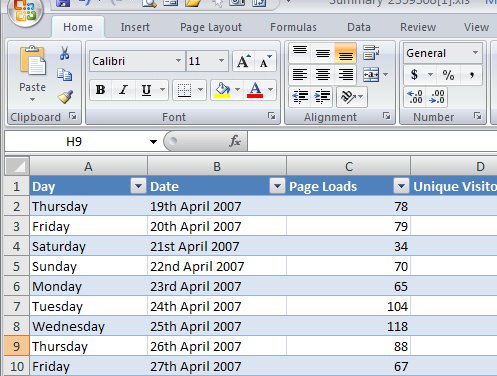
When you create a list you automatically get Filter buttons for the list. If you don’t like or want them, disable them by clicking to disable the Filter button on the Data tab – just make sure your cell pointer is somewhere in the list when you do this. Like in Excel 2003, if you create a chart based on your table, it expands when you add new data to it.