Friday, May 4th, 2007

Reuse a Chart’s "Look"

Sometimes you’ll create a chart that just looks so good you want to save the ‘look’ so you can use it again. You can do this by turning your chart into a template. This would be a technique you could use if you were creating a report and you need to use multiple charts that are all formatted in a similar way.

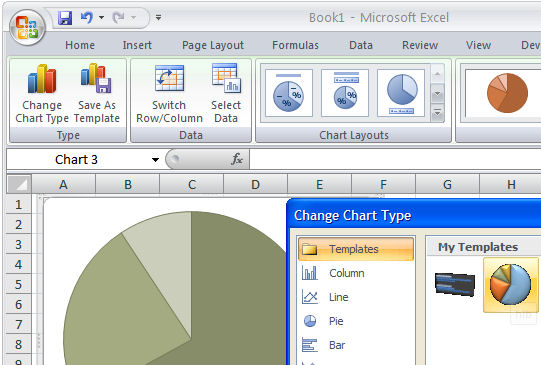
To save a chart as a template, first display or create the chart and select it. On the Chart Tools, Design tab, choose Save As Template in the Type group. In the Save In box check you’re using the Charts folder and type a name for your template and click Save. Later, to apply the template, to a chart you’re about to create, select your data the Insert tab, click the Other Charts button to open the list and choose All Chart Types. Choose Templates and then the template you just saved. If you already have a chart created, click the chart and click the Design tab, then Change Chart Type. Click Templates, then click the template to use from the My Templates area.

You can store lots of templates to meet any need you might have and change from one to the other as required.

Helen Bradley

Thursday, May 3rd, 2007

Gilding the Lily – Animating SmartArt

I love the new SmartArt feature in Office 2007 and I’d buy Office just to get hold of it. The images are drop dead gorgeous and they’re so easy to make and to color.

So, what’s better than great looking SmartArt? Animated SmartArt, that is. Launch PowerPoint 2007 and create a SmartArt object. Select it and then click the Animations tab. From the Animate dropdown list choose One by One and Preview the result – deliciously animated SmartArt. Of course, you can do all sorts of Animations – this is just to whet your appetite.

Fun huh?

Helen Bradley

Wednesday, May 2nd, 2007

Hide the Ribbon in Office 2007

Ok, I’m on record, I love the ribbon in Word but on my laptop with its scrunched up screen (in the tradeoff between size and weight, I opt for weight!) the ribbon is sometimes too big.

Not a worry, it’s simplicity itself to hide it. Press Control + F1 and it disappears and press it again and it reappears. You can also have it disappear so it will come back with a single click on any tab name. To do this, double click a tab name and the ribbon disappears. Single click a tab name and it reappears – click again on the tab or in the document, and it disappears. Repeat until you’re tired of the magic! Double click or Control + F1 to go back to how it is.

It’s a neat party trick to play on a co-worker (no! I did not tell you to do that), and a great way to buy back some much needed screen real estate.

Helen Bradley

Tuesday, May 1st, 2007

Hide or color Excel gridlines

Ok, grey is my favourite colour – it’s the colour of my old school uniform. I’m an Aussie and we still wear uniforms to school! Mine was grey serge in winter and grey cotton in summer, complete with hats and gloves. I kid you not and this is seriously OT and it uses Australian spelling so I’ll get back to what I was saying.

Ok, so gray might be my favorite color but it’s probably not yours. If Excel’s gray gridlines offend your color sense, you can change them or remove them entirely. To remove them choose Tool, Options, View tab and disable the Gridlines checkbox.

To change the color of the lines, choose Tool, Options, View tab and choose an alternate color from the Gridlines color dropdown list. If you didn’t realise gridlines were little dots and not solid lines, you’re about to see that that’s exactly what they are.

Helen Bradley

Page 3 of 3123