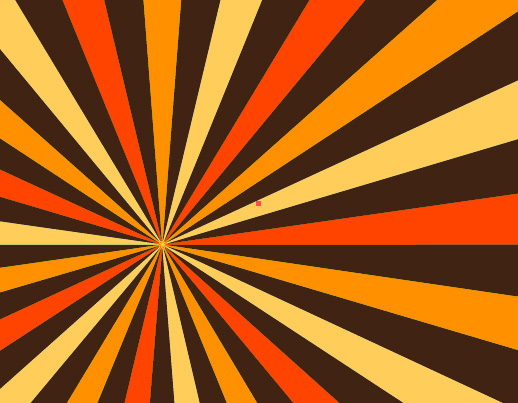
So, you know how to make a sunburst in Illustrator – here’s how to color it
Some time ago I wrote a post and created a YouTube video to show how to make a sunburst in Illustrator. This is one of my most popular posts and the video has been popular too – seems like it really hit a spot with a lot of readers.
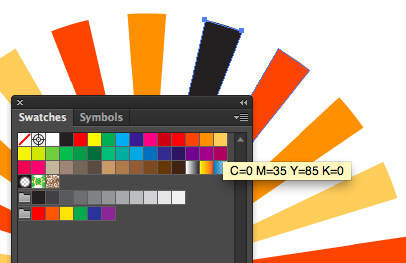
Now, today I received an email from a reader asking how to make the sunburst multicolored. Turns out it isn’t as simple as selecting a ray and recoloring it – because when you select one ray you select them all. However, once you know how to break them up, it works just fine.
To do this, follow the instructions to create the circle, add the dashed line, expand it, select the inside anchors and choose Path > Average. This gets the sunburst made.
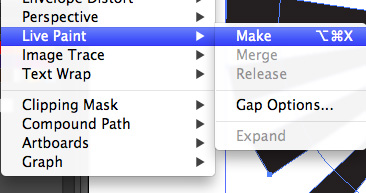
Now, to break the shape up, select it and choose Object > Live Paint > Make. Now you can use the Live Paint Bucket tool to color each piece of the sunburst – or not. You see the Live Paint > Make command breaks up the shape (in a way that Object > Expand does not) so you can now select each ray in turn and color it.
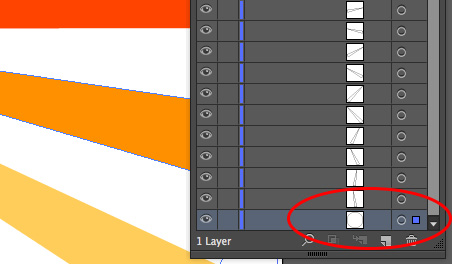
If you want to see the change happen, watch the Layers palette when you do the Live Paint > Make command – it turns the compound path into a set of individual vector objects – just what you need to have to be able to recolor them. The plus is that once the shape is broken up like this you can recolor it in the usual way by selecting each shape and color it or you can use Live Paint. You get to choose which works best for you.
Now, one side effect of this is that the spaces between the rays is filled with color – typically white. So you can’t put a solid color behind the rays and have it show through. There is a solution – open the Layers palette and locate the filled white circle shape at the bottom of the expanded sunburst shapes and delete it. Once it is deleted you can add your own background filed shape behind the sunburst.
It’s one of those things that is simple when you know how but not immediately obvious how you do it.
Thanks to the reader who asked the question!


