Friday, March 15th, 2013

Motion charts in Google Docs

Gadgets allow you to do things with Google Docs that would be time consuming if not beyond most people’s skills to create in a program like Excel. In this article I’ll demonstrate how to create a motion chart in Google Docs spreadsheet.

Prepare the data
In the first column of a new worksheet type the name of the item you’re charting such as office locations – we’ll use City and Bayside. In the next column, type the period that the data is for – this needs to be a time field such as year, week or quarter. The data needs to conform to ISO8601 so use 2011 for a year, 2011W08 to enter week eight of 2011 or 2011Q2 for second quarter 2011.

In the next column, type the data to plot such as Profit. The next columns are optional but we’ll add one which records units sold. To have some data to work with, add at least five years of data for the two offices.

Add the Gadget
Select over the entire range (including headings), and choose Insert > Gadget > Charts and scroll to find the Motion Chart and click Add to Spreadsheet. In the dialog which appears, the range should already cover the selected range, leave the Default State empty for now and type a title for your chart such as 5 Year Office Comparison and click Apply & Close.

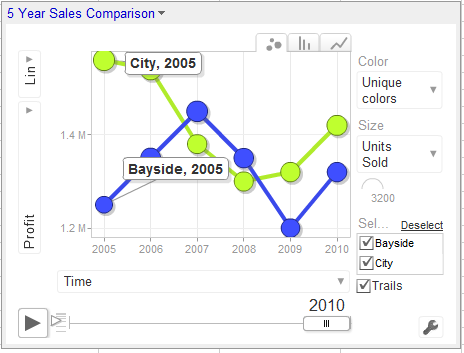
The chart appears on the screen but requires some customisation to  work. From the fly out menu of Y axis options on the left select Profit and then from the X axis dropdown list select Time so you plot Profit against Time.

From the Color dropdown list, select Unique Colors and from the Size dropdown list, select Units Sold.

Click the Play button and the chart will play showing the change in your data over time. The Y axis movement shows movement in Profit and the size of the bubble shows change in Units Sold.

The tabs change the chart from a Bubble to a Column or Line (this is not a motion chart).

If you click the office checkboxes and Trails you will see additional labels on your data and to the right of the Play button is a slider which controls playback speed.

Save the default
Wind the play button back to the beginning. Click the Settings button and click Advanced and Advanced again. Double click the state string to select it, right click and choose Copy. Click the chart title to display the chart menu, click Edit Gadget and paste the string into the Default State textbox. Save the worksheet and the chart will appear whenever the worksheet is viewed and it will be configured as you set it up to look.


Helen Bradley

Tuesday, January 10th, 2012

Pattern fills for your Excel 2007 charts

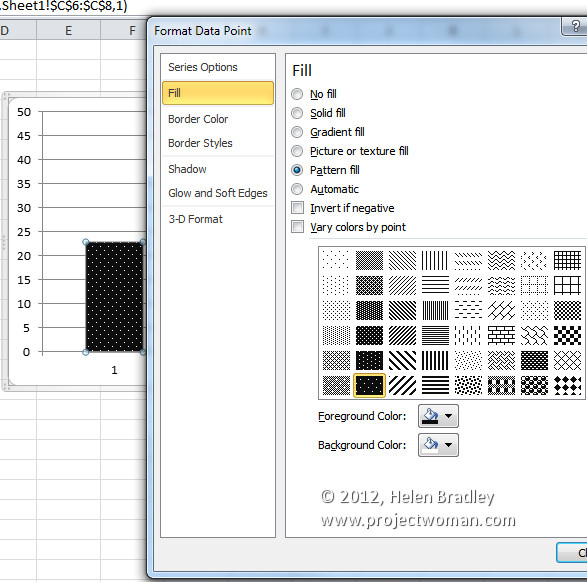
In Excel 2003 and now in Excel 2010 , there are pattern fills which you can use to fill chart bars so your charts print just great in black and white.

Unfortunately the same feature was removed from Excel 2007 – wtf? I have no clue why but it was but it has to be a very silly thing to have done.

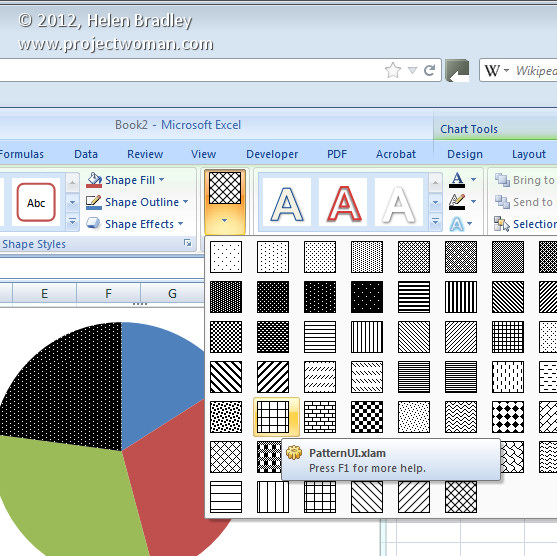
If you are using Excel 2007 and you need to use pattern fills with a chart you are out of luck – well not really – you just need to read the rest of this tip because I can tell you how to put the fills back into Excel 2007.

To begin, download this handy add-in: http://officeblogs.net/excel/PatternUI.zip 

Update: This link is no longer live so patternui.zip is not longer available. You can find an add-in here (with instructions which achieves the same thing) courtesy of Andy Pope.

The zip file contains a single file patternUI.xlam which you need to extract and place somewhere you will find it easily and where it won’t get deleted by accident. You could make an Excel add-ins folder for it, for example.

Once you’ve done this, open Excel 2007 and choose the Office button > Excel Options > Add-ins and from the Manage dropdown list, select Excel Add-ins and click Go. This opens the old Add-ins dialog from earlier versions of Excel. Click Browse and locate the .xlam file that you just unzipped and placed somewhere safe. Select it and click Ok. Ensure that the PatternUI option appears in the Add-ins available list and that it is checked and click Ok.

Now create an Excel chart. Once you have you chart, click on the data series to fill with a pattern – if you have a single series plotted then select just one of the columns at a time. Select the Chart Tools > Format tab and notice that you now have an option called Patterns available. Click the Patterns option and select a pattern to apply to the currently selected chart series or column. Click on each series or column in turn and apply a pattern to it. When you are done, you can print your chart as usual.

Installed add-ins are managed automatically by Excel so you will find that the add-in will still be there and accessible next time you use Excel.

If you are using Excel 2010 you don’t need this add-in as the pattern fills are back where they should have been all the time.

Helen Bradley

Monday, November 19th, 2007

Excel charts – create an overlapping series

Sometimes an Excel chart will look better if your series overlap – this might be the case when you are comparing data from two years and where you want to show how the values have increased from one year to the next.

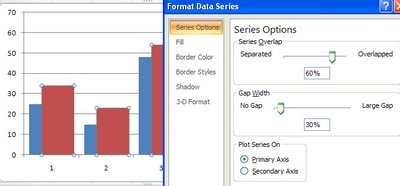
To make your series overlap in Excel 2007, select one series, right click and choose Format Data Series. Click the Series Options and decrease the Gap Width (it closes the chart up nicely) and incease the Series Overlap. Set the Series Overlap to around 60% and the Gap Width to around 30% for a good result. This is particularly useful when you are using images in place of colors for the bars of your chart but works in almost any situation.

Helen Bradley

Wednesday, November 7th, 2007

In-cell charting in Excel 2007

For a long time Excel users have wanted a way to plot a bar showing the relative magnitude of a range of numbers without having to resort to a chart or complex formulas to do this.

Now, with Excel 2007 this feature is now built in and dead easy to use. To try it out, first type a series of numbers in a column, then select the series. Click the Home tab and click the Conditional Formatting button.

Select Data Bars and then select the color of the bar to use. The relative length of each colored bar indicates the relative value of the number in that cell.

There is one caution, however. All values – even very small values will be given a minimum bar length of 10% so they can be seen – so, use this feature as a guide and not an accurate measure.

Helen Bradley