

One issue I was faced with recently was the need to calculate monthly totals for worksheet data that was recorded for every day of the month for a few years.
I had a long series of dates with corresponding data in the cells to the right which I had downloaded from the web. The data needed to be viewed as monthly totals rather than as daily values for me to have a better picture of the changes over time.
The solution to doing this quickly and easily is a PivotTable. Here’s how to do it:
1
Select all the daily data including the column headings. If you have lots more columns of data than you plan to analyze, don’t worry, just select the lot for now.
2
In Excel 2007, choose Insert > Pivot Table. In the PivotTable Field List you now need to drag and drop fields into the respective boxes on the screen.
Drag the Date field into the Row Labels box and drag the field for the data that you want to analyze into the Sum Values box.
3
This gives you a list of dates and the data on the screen and you’re over half way to your monthly totals.
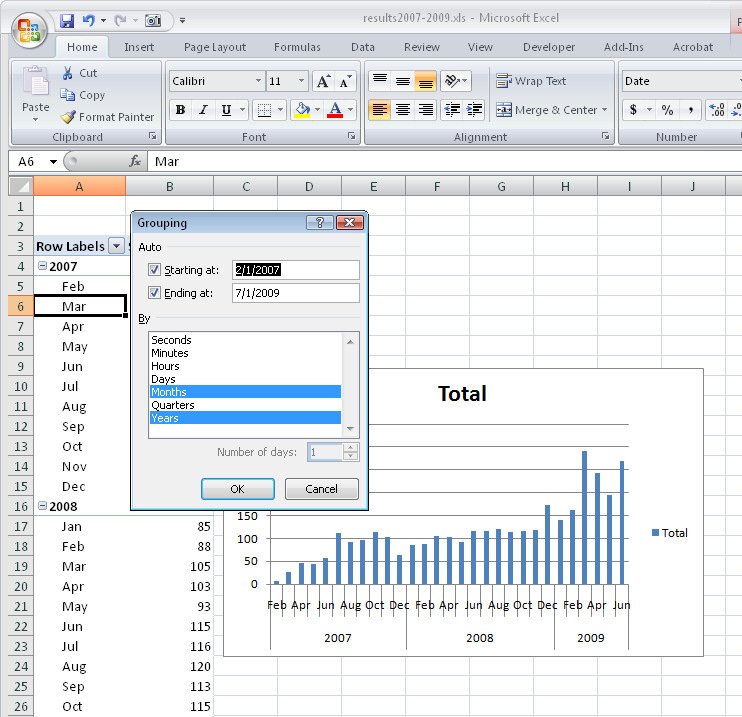
Click on one of the dates in the Row Labels column to select that cell, right-click and choose Group to display the Grouping box.
4
Click both the Month and the Years values in the list so that both are highlighted. Then click Ok.
5
Now your data will reappear grouped by the year and by the month within that year.
This allows you to analyze how the data has changed over time more easily than viewing it by day.
6
From here, to chart your data, click somewhere in the PivotTable, choose Insert > and then from the Chart area on the Ribbon click the Column option to create a column charts.
Select the chart sub-type and you’ll create a chart displaying the monthly totals from the PivotTable.
A PivotTable, while a little harder to get a feel for creating than a typical Excel formula, is actually the quickest and easiest way to summarizing this type data.