Saturday, May 31st, 2008

Conditional formatting with Date ranges

One of the other handy features of the new conditional formatting tool in Excel 2007 is that it can handle date formatting. For example, if you have a worksheet with a series of dates in it you can highlight the dates that correspond to a period of time.

Choose Conditional Formatting > Highlight Cells Rules and choose the A Date Occurring option. You can then format cells using rules such as Yesterday, Today, in the last seven days, this month, next month, next week, etc.. When you do this cells containing dates which match this criteria will be coloured appropriately. Better still, when the date changes, the formatting on the worksheet will change accordingly.

Helen Bradley

Thursday, January 10th, 2008

Format alternate rows in a worksheet

When you’re working with a large worksheet where the data appears in rows across the sheet, you may find it difficult to keep track where you are as your eye moves across a row. You can solve this problem by formatting each alternate row in the worksheet a different colour.

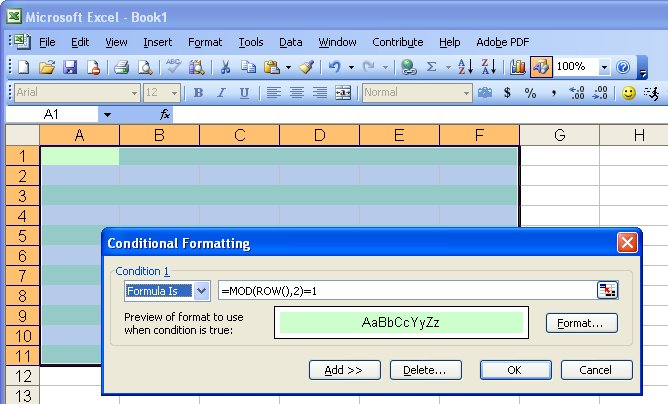
Select the entire worksheet, or just the area containing the data, and choose Format, Conditional Formatting. From the first dialog choose Formula Is and, in the text area to its right, type =mod(row(),2)=1. Click the Format button and set the format to use for each alternate row in your worksheet (a light pastel colour is a good choice). Click Ok twice and each alternate row in your worksheet will be formatted accordingly.

You can apply the same concept to formatting alternate columns if this is the way you view the worksheet. In this case use -=mod(column(),2)=1.

This formula uses the MOD function which calculates the remainder when the current row number is divided by 2 and then tests to see if it is equal to 1. If it is, then the row is formatted, if not, it isn’t. For the first row, the remainder when the row number (1) is divided by 2 is 1 and that is equal to 1 so the answer is true and the format is applied to the first row. The same result happens for each odd numbered row (any odd number divided by 2 gives a remainder of 1). For even numbered rows, there is no remainder so 0=1 is a false statement and the format is not applied.

Helen Bradley

Wednesday, November 7th, 2007

In-cell charting in Excel 2007

For a long time Excel users have wanted a way to plot a bar showing the relative magnitude of a range of numbers without having to resort to a chart or complex formulas to do this.

Now, with Excel 2007 this feature is now built in and dead easy to use. To try it out, first type a series of numbers in a column, then select the series. Click the Home tab and click the Conditional Formatting button.

Select Data Bars and then select the color of the bar to use. The relative length of each colored bar indicates the relative value of the number in that cell.

There is one caution, however. All values – even very small values will be given a minimum bar length of 10% so they can be seen – so, use this feature as a guide and not an accurate measure.

Helen Bradley

Thursday, February 22nd, 2007

Excel – finding duplicates

Excel’s conditional formatting option has lots of handy uses including highlighting cells that contain duplicate data.

To do this, highlight the range to investigate, for example, a series of entries in column C starting with cell C1. Now choose Format, Conditional Formatting, select Formula Is and enter this in the formula area:

=COUNTIF($C:$C,$C1)>1

Click Format and then select a pattern and color to use and click Ok.

Now duplicate entries in the column will be indicated with the shading you’ve provided. You can copy and paste this formatting down to other cells in column C to include them.

Helen Bradley