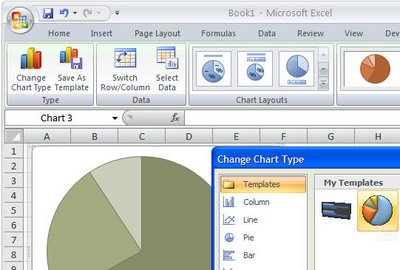
Sometimes you’ll create a chart that just looks so good you want to save the ‘look’ so you can use it again. You can do this by turning your chart into a template. This would be a technique you could use if you were creating a report and you need to use multiple charts that are all formatted in a similar way.
To save a chart as a template, first display or create the chart and select it. On the Chart Tools, Design tab, choose Save As Template in the Type group. In the Save In box check you’re using the Charts folder and type a name for your template and click Save. Later, to apply the template, to a chart you’re about to create, select your data the Insert tab, click the Other Charts button to open the list and choose All Chart Types. Choose Templates and then the template you just saved. If you already have a chart created, click the chart and click the Design tab, then Change Chart Type. Click Templates, then click the template to use from the My Templates area.
You can store lots of templates to meet any need you might have and change from one to the other as required.


Post a Comment
Please feel free to add your comment here. Thank you!