

Wednesday, June 10th, 2009
Multi colored Excel charts
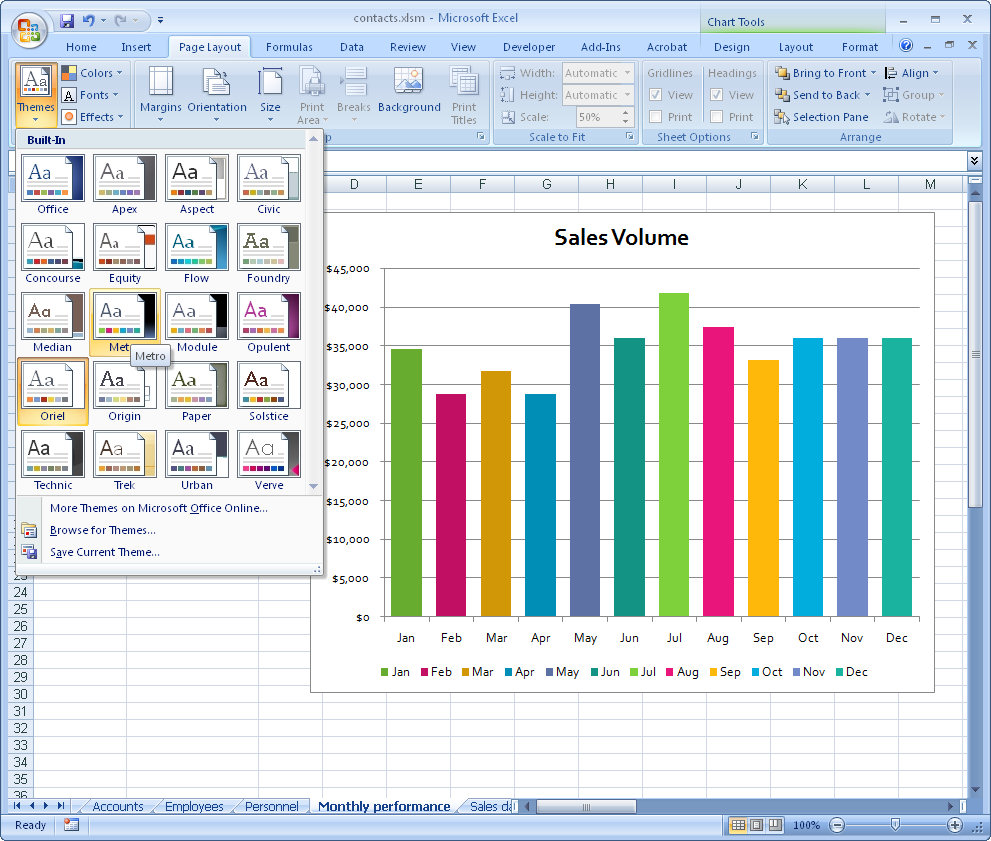
It isn’t always the case that you want to chart multiple series of data on a single chart. Sometimes you only have a single series and Excel, by default, plots all the bars or columns so they are colored identically. Boring!
Luckily, in Excel 2007 a solution is at hand. Simply select and right click the series and choose Format Data Series > Fill > Vary Colors by Point. Excel colors each bar a different color. Best of all, the colors are linked to themes so you can change the colors by changing the Theme – the theme tools are on the Page Layout tab.
So, no more boring single color charts – ever – please!
Labels: chart, Excel 2007, multicolored, series
Friday, May 29th, 2009
Make your own font character – FREE!
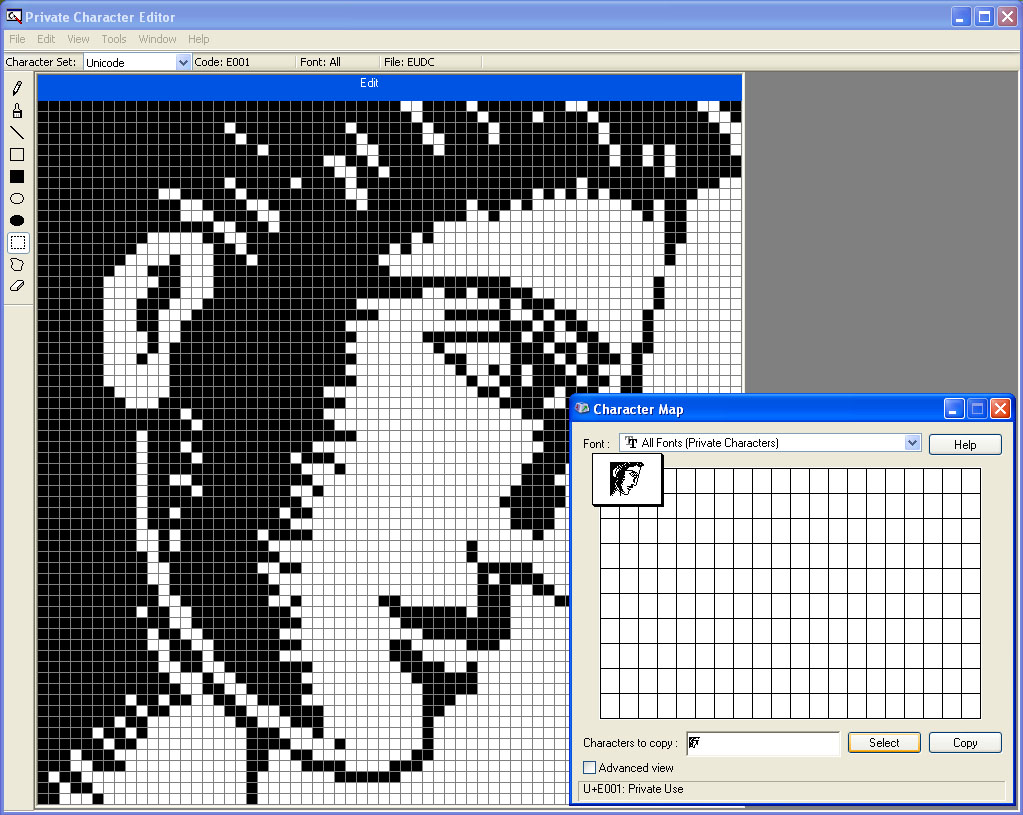
If you’ve ever wanted to create a special font character for your company logo or a favorite shape you can create it using the Windows Private Character Editor utility which is available in Windows XP and Vista.
To run it, choose Start > Run > type eudcedit and click Ok.
When the character grid appears, double click any one of the empty boxes to open up a 64 x 64 pixel grid where you draw your character.
You can also copy an existing font character and edit that by choosing Window > Reference > Font and choose a font to copy a character from. Select the character, make a selection around the it and drag it onto your work area. You can now edit it using the tools on the toolbar.
You can also import any black and white image. Open your graphics software, open an image and size it down to 64 x 64 pixels in size and convert it to black and white.
Now copy and paste it into the Private Character Editor.
When you’re done editing, choose Edit > Save Character to save your character to your font collection.
To use your new character, open the Character Map tool by choosing Start > All Programs > Accessories > System Tools > Character Map. Choose All Fonts (Private Characters) from the font list.
To use your new character, click it, then click Select and then click Copy. Switch to your application, for example, a Word document and choose Edit > Paste.
Labels: custom font character, eudcedit, private character editor
Monday, May 25th, 2009
Publisher – Making Signs
Whether you need to make an open sign for your business or one to help find a lost pet, the basic premise is the same. You have a message you want to get across to your audience and you need to do this in the best and most effective way.
Signs pose difficulties not always present in other documents – you don’t have a lot of room to get the information across and often the sign will be placed where there is lots of other signage competing for attention.
Before you start
Before you make your sign, determine what you want to say and what information is most important for your audience to see. For example, for an Open sign, the word OPEN is critical and it will work without any other words very well. For a lost pet sign, the word Lost is important as it distinguishes the sign from others about pet grooming services, kennels etc.
Size of letters are important – a sign to be viewed from 3 yards/metres distance will need to have letters around 2.5cm/1 inch in height and you can add an extra 2.5cm/1 inch for every extra 3 metres/yards away your audience will be. The font size equivalent for letters 2.5cm/1 inch in height is around 72 points.
Colour is vital and it’s important that your sign be visible. The best colour combinations are high contrast ones such as black on yellow and white on black. Bad combinations are green on red or red on green – they’re indistinguishable to colour blind people and hard to read for the rest of us.
If you must use low contrast colours such as pale blue on white, add a black border around each letter to distinguish it from its surroundings.
When choosing fonts for your signs, stick to plain readable fonts and steer clear of script and other fancy typefaces. Fonts like Times New Roman and Arial and Verdana are good as they are clean and easy to read.
Capture interest
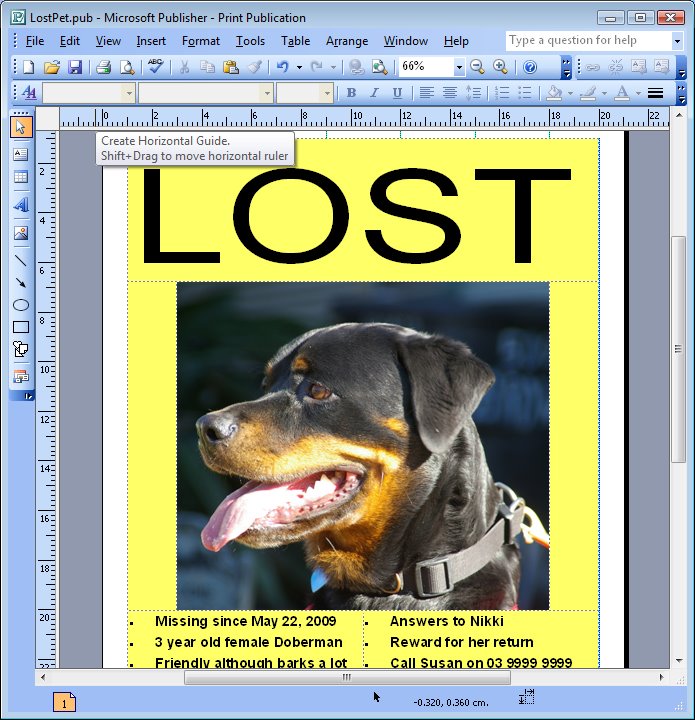
When you’re using photos to capture attention and to inform, make sure they are high quality and cropped to show the pet clearly. When typing information, group it logically so it’s easy to read. Include the details a person will need to have to contact you.
In the situation where immediate contact is crucial, creating tear off strips across the foot of the page is a good idea – a person can simply tear off the information they need and take it with them. However, make sure you also put the information on the sign as a person will need to have this available if the tear off strips are already removed.
Here’s how to create a sign with tear off strips.
Step 1
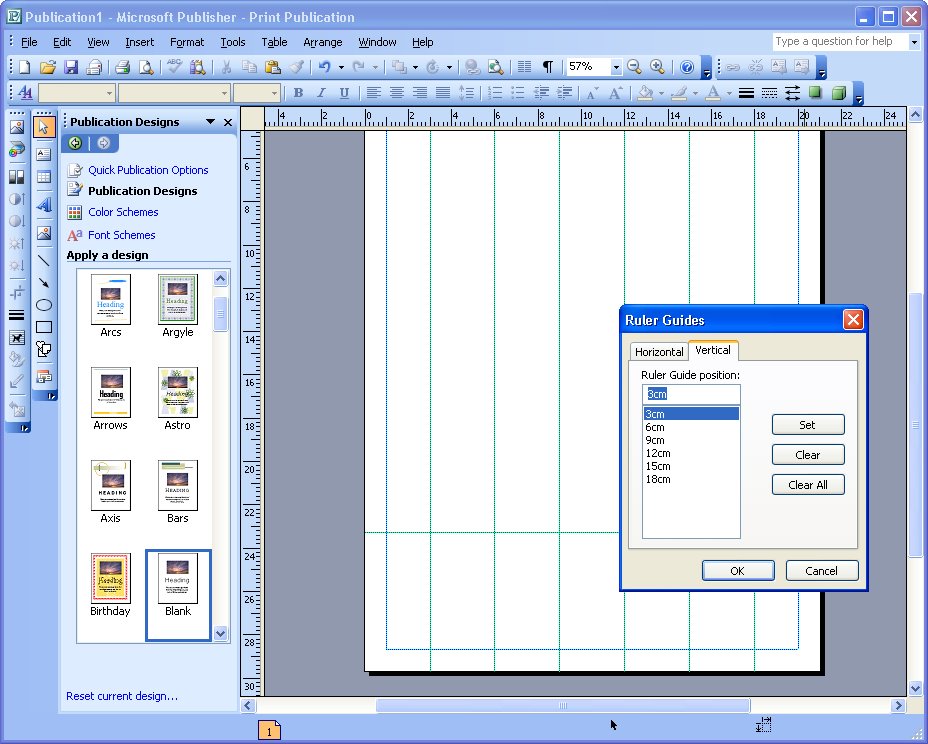
Start a new blank print publication. Choose File, Page Setup and set up full page printing and Letter or A4 paper size depending on the paper you will use. Choose Arrange, Layout Guides and adjust the margins to match your printers margins – the defaults are generally too big. Choose Arrange, Ruler Guides, Format Ruler Guides, vertical and add them at equal intervals across the page. Add one horizontal ruler across the bottom of the page.
Step 2
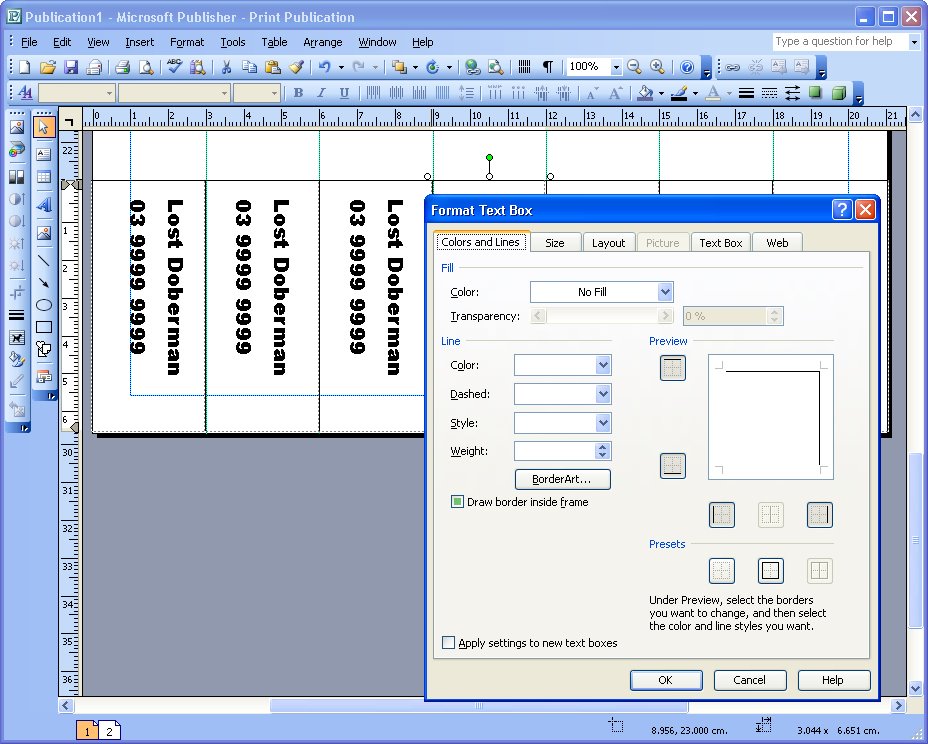
Create a text box and, in it, type the contact details for the tear off strip. Rotate the text by right clicking the shape, choose Format Text box, Text Box tab and check the ‘Rotate text within AutoShape by 90 degrees’ checkbox. Click the Colors and Lines tab and add a line to the top and right of the box. Drag the box into position and size it to fit. Hold Control as you drag a duplicate of the box to make the second box. Continue to complete all the boxes.
Step 3
Complete the rest of your sign by adding a large text message to attract a viewer’s eye. Add other explanatory text – make sure to include your phone number or contact details in the main notice in case all the tear off strips are removed. Focus on the important details someone will need to know. Add an image if desired to help attract attention.
Labels: making signs, Microsoft Publisher, publication, step by step, tear off strips, tutorials
Friday, May 22nd, 2009
Excel – print charts in black and white
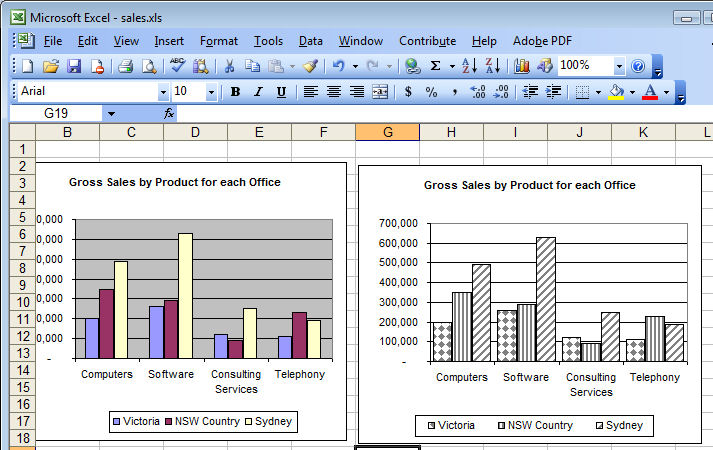
Although your Excel chart might look great in color on the screen, if you’re printing to black and white or printing in color and planning to reproduce the charts in black and white you might be disappointed with the final result. Light green, light blue and light orange all look very different on the screen but are indistinguishable in black and white.
So, when your chart is destined for reproduction in black and white, set it up so it is guaranteed to be readible. To do this, select each series or data point by clicking on it, right click and choose Format Data Series (or Format Data Point)> Patterns tab > Fill Effects > Pattern and use a grey or a black and white pattern. Repeat for all the series and save before printing. The chart is guaranteed to look good when printed.
Labels: black and white, chart, Excel 2003
Wednesday, May 6th, 2009
What cell is that? Identifying table cells in Word
When you’re working with Word and doing math in your tables, you need to know the name of each table cell. In a largish table it can be difficult to keep track of everything.
Back in the days of Word 97 a macro shipped with Word that would tell you the name or cell reference of a given table cell. Here’s how to take a step back in time and get that macro, install and use it, with later versions of Word:
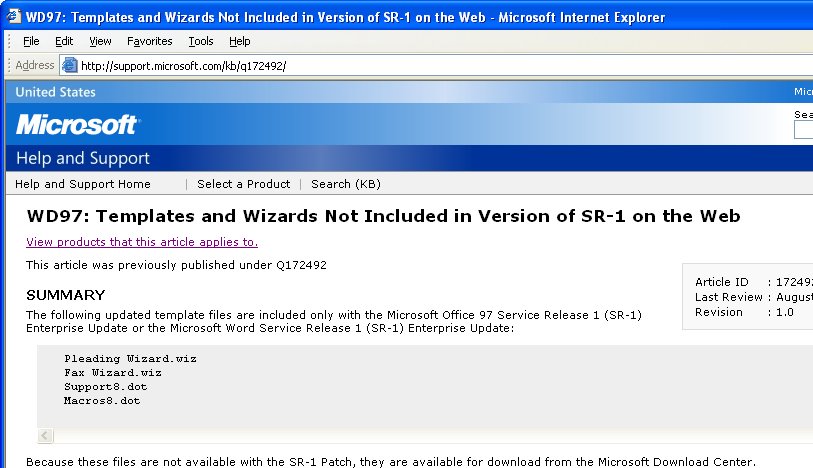
Visit http://support.microsoft.com/kb/q172492/ http://download.microsoft.com/download/word97win/addin/1.0/W9XNT4/EN-US/Wdtlupd.exe and download the file Wdtlupd.exe which is referred to on this page. This is a self-extracting zip file which includes various documents, the one we’re using is not version specific. Run this file and select a location to save the extracted files into.
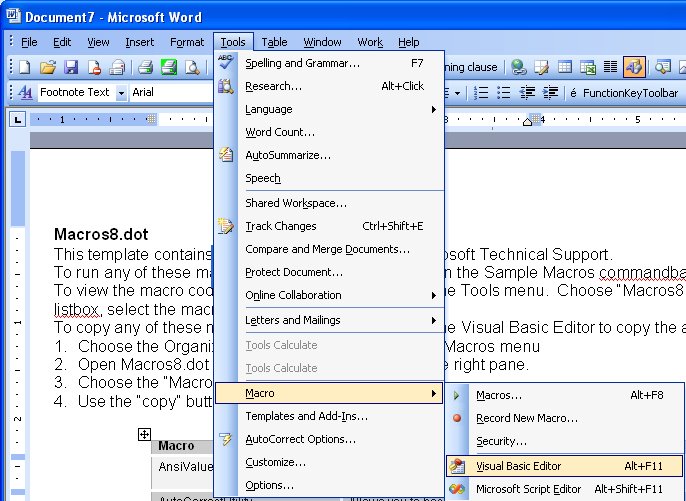
Open the folder containing the extracted files and double click the file macros8.dot to open it in your version of Word. If prompted to do so, click the Enable Macros button and the file will open automatically in Word. Now choose Tools, Macros, Visual Basic Editor if you are using Word 2003 or earlier. In Word 2007, make sure the Developer tab is visible (Office button > Word Options > Popular > Show Developer tab in the Ribbon). Choose Developer tab > Visual Basic.
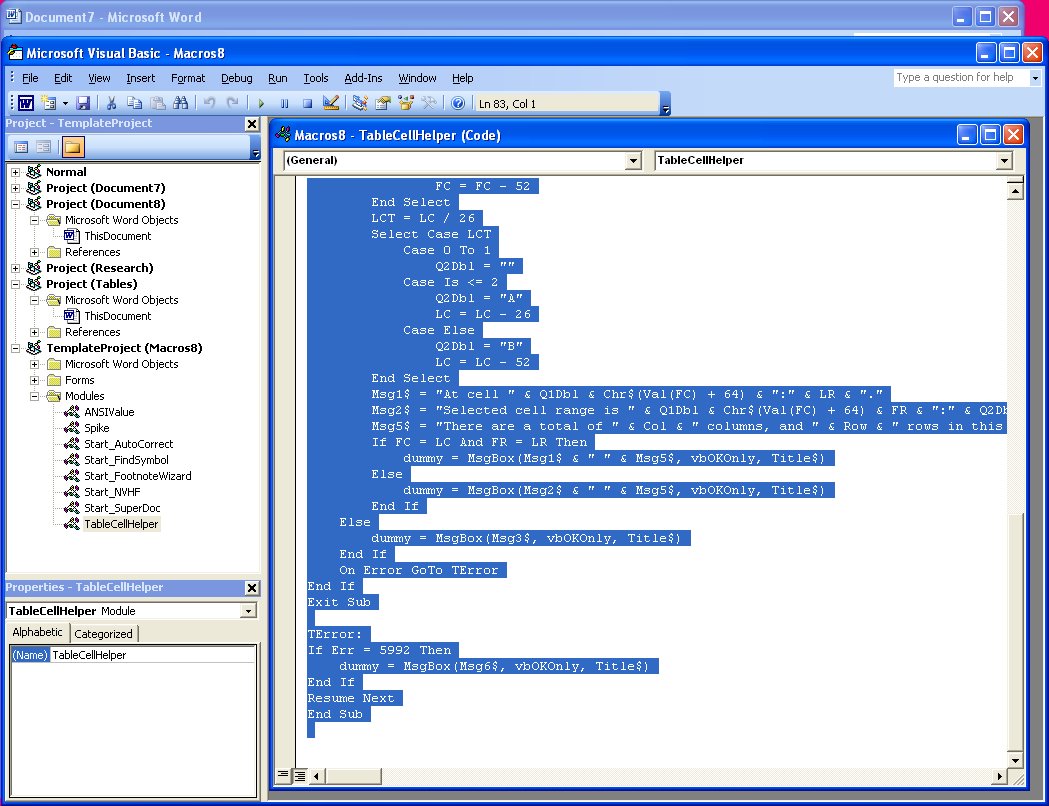
Locate the Macros8.dot file in the Project list on the left of the screen and click to open its Modules collection. Locate the module called TableCellHelper and double click it open the code window. Select the code and copy it by choosing Edit, Copy.
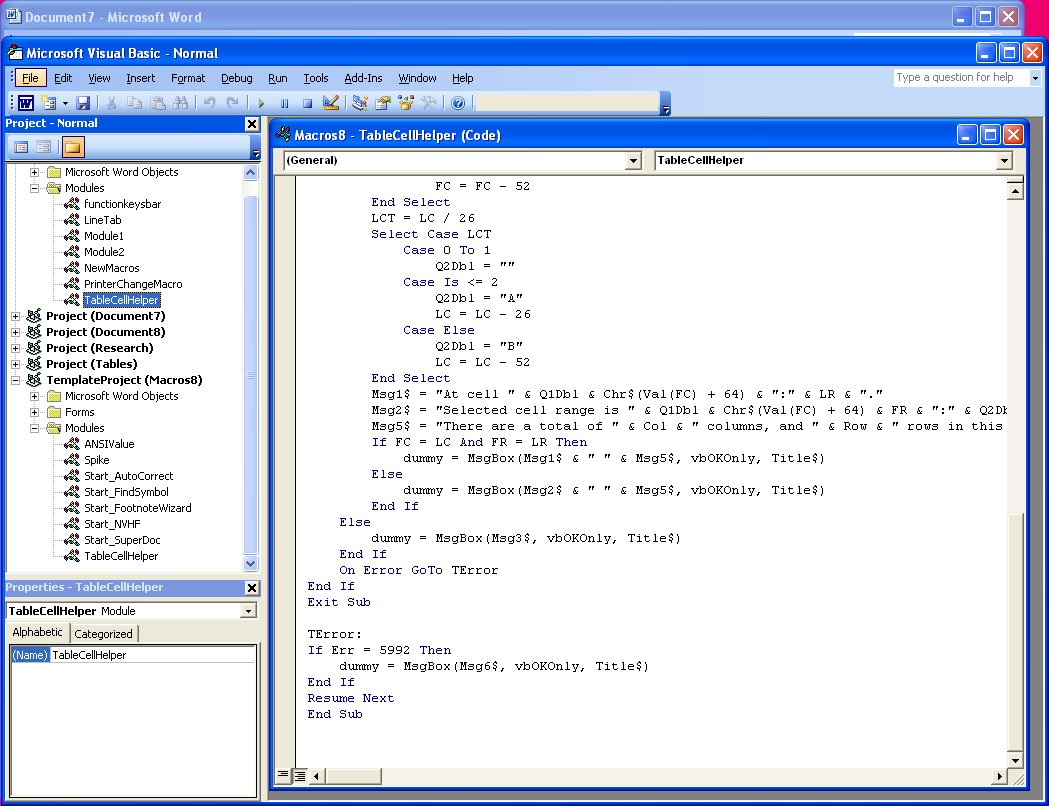
Locate the file Normal in the Project collection and click its Modules collection. Choose Insert, Module to add a new module, double click to open this new module and choose Edit, Paste to paste the copied code into the module. In the Properties area (choose View, Properties Window to display this if needed), alter the module name to TableCellHelper and, when you’re done, close the Visual Basic editor and close the file created using Macros8.dot.
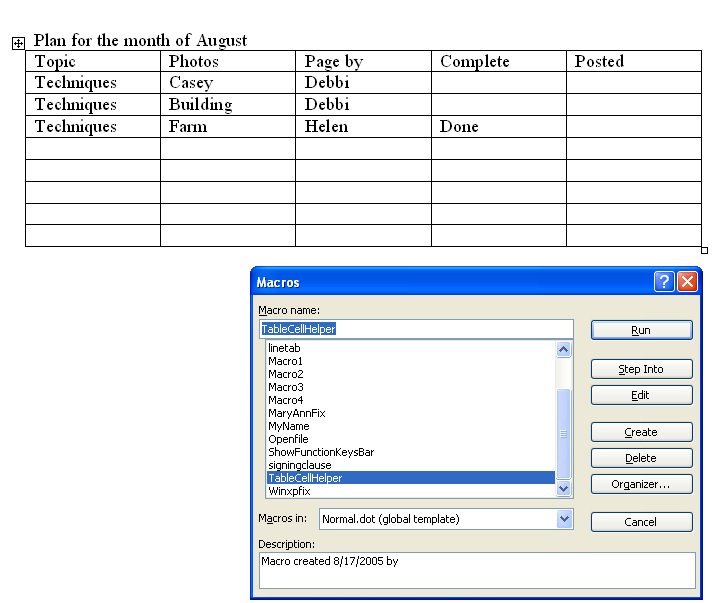
In Word 2003 and earlier, run the macro by clicking somewhere inside a table and choose Tools > Macro > Macros from the Macros in list choose Normal.dot and locate and run the macro called TableCellHelper. In Word 2007 click the Developer tab > Macros and from the Macros in list choose Normal.dotm and locate and run the macro called TableCellHelper. The macro will report the cell address and the total number of rows and columns in the table.
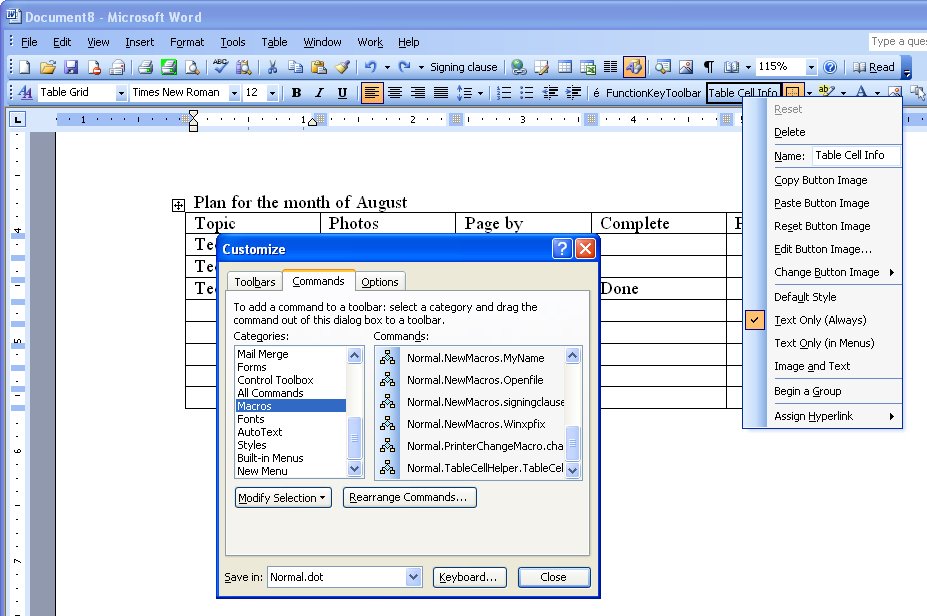
If you’d use this macro repeatedly, add it as a button to your Word 2003 (and earlier), toolbar by right clicking a toolbar and choose Customize. Click the Commands tab, select Macros from the Categories list and locate and drag the macro TableCellHelper on to the toolbar. Right click the new button and edit the name so it is shorter and more helpful. Close the Customize dialog.
- Updated 4 Oct 2017 to list a new download site for the file.
Labels: Blog in Word 2007, formulas, HP Tablet, Macro, macros8.dot, math, Table cell helper, Word 2003
Tuesday, May 5th, 2009
Word does Math – in tables!
Lots of folk do things like use Word for invoices simply because it’s easy to do. When it comes to laying out data for an invoice a table makes a good choice as everything looks very neat.
It is also a good choice because, once your data is in place, you can get Word to do the calculations for you.
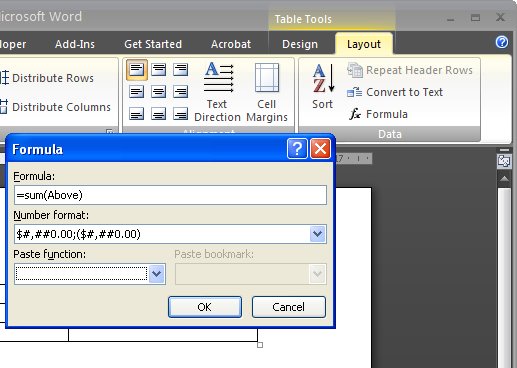
So, for example if a column contains a series of numbers that you want to add up, click in the blank cell at the bottom of the column of numbers and choose Table > Formula (in Word 2007 choose the Table Tools > Layout > Formula button). Make sure the formula reads =sum(above) and click Ok. Now the total is in place in the cell.
If you change the numbers in the cells above, you’ll need to recalculate the formula. To do this, click in the cell containing the formula and press F9.
The Table Formula dialog also includes an option for formatting the numerical result so it looks the way you want it to – with numbers after the decimal point and even a leading $ or £ symbol.
Labels: formulas, table cells, Table math, Word 2003, Word 2007
Wednesday, April 22nd, 2009
Word 2003 – Disable the Insert key
If you still use Word 2003 or earlier you’re at risk of Word suddenly taking off and gobbling up text as you type. The problem is that the Insert key toggles insert/overtype mode and if you press it by accident you can end up in overtype mode so everything you type just replaces something else! Yikes it can be frustrating.
Now, Microsoft solved the problem in Word 2007 by disabling the Insert key so it no longer switches into overtype mode any more. That annoys some folks so I wrote a post here about fixing it so it goes back to its old behaviour. But this post is for hapless Word 2003 users and I’ll show you how to disable the Insert key so it won’t switch into overtype mode. The solution only affects Word so your other programs work as expected.
To disable your Insert key, choose Tools > Customize and click the Keyboard button. Scroll to find the All Commands category and scroll the Commands list to locate the Cancel option. In the Press new shortcut key box click once and then press the Insert key. Click Assign and then Close. This assigns the Insert key to the Cancel command so that it no longer operates OverType mode.
If you ever need to use OverType mode, double click the OVR indicator in the status bar to enable or disable it.
Labels: disable Insert key, overtype, typeover, Word 2003
Thursday, April 16th, 2009
Send to PowerPoint missing? Not really!
In Word 2003 you could create an outline in Word and then send it to PowerPoint where it would be converted to a PowerPoint slide show. Level 1 became the slide title and level 2 the first level bullet points and so on.
I hear a lot of grumbling that this feature has been removed from Office 2007 – not so! It just isn’t quite where you expect it to be. In fact, you have a few options in PowerPoint 2007 and Word 2007.
Option 1
You can add the Send to PowerPoint button to the Word 2007 Quick Access toolbar by clicking the Office button and choose Word Options > Customize and from the Commands not in Ribbon collection choose the Send to Microsoft Office PowerPoint option and click Add to add it and then Ok. Now you can click it to send the outline file to PowerPoint.
Option 2
You can also approach the task from PowerPoint 2007 which is really the better option. One alternative is to open the Word outline file in PowerPoint and the slides will be automatically created for you. To do this click the Office button and choose Open and from the Files of type list choose All Files so you can see and open your Word file.
Option 3
This is my fave!
Open PowerPoint 2007 with a new slide show and make sure your Word 2007 outline file is closed.
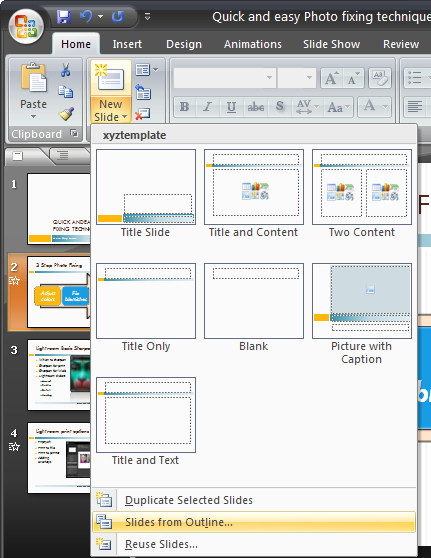
Choose the Home tab on the Ribbon and click the little arrow on the New Slide button. This opens a menu which includes the option Slides from Outline – select this and open your Word 2007 outline file. The slides are automatically created for you.
So, the option to Send to PowerPoint is not there in Word 2007 but you have so many more ways to complete the task now.
Labels: PowerPoint 2003, PowerPoint 2007, send to PowerPoint, Word 2003, Word 2007
Thursday, April 9th, 2009
Cool Word 2003 and 2007 Breakout Boxes

Breakout boxes or pull quotes are a great way to add visual variety to a very text heavy document. Even if you don’t have images you can use you can still add some color and interest to the page. To do this, you will need some text to use – ideally it will be an interesting quote or sentence or two from the document itself. You will copy this so it appears in the correct position in the text but so it is also a feature element on the page.
Create a textbox
Start by selecting and copying the text. Click outside the text so it is no longer selected and choose Insert > Text box and draw a textbox on the page. Click inside it and choose Edit > Paste to paste in the text on the clipboard.
Format the text
Text in a breakout box looks better if it is formatted differently to the surrounding document, for example you may want to center it, change the font and adjust the line spacing to double line spacing so that the text looks very different.
Format the text box
You can add a colored background behind the textbox by selecting the textbox and choose Format > Textbox and from the Colors and Lines tab select a Fill Color for the textbox. To remove the border line, choose Line Color > No Line (or choose a line option that you like), and click Ok.
Add quote marks
Adding an oversize pair of quotation marks helps delineate the breakout box or pull quote from the remainder of the document. In this instance it’s best to place the oversize quotation marks each in a separate textbox, format them so they are very large, set the textbox so that the fill color is set to No Fill and the line color to No Line and then drag it into position over the textbox that contains the breakout text.
Set the wrapping
If you set this small textbox’s wrapping to in front of text the text will not be forced to wrap around it and the textbox with the pull quote will control the wrapping not the double quote marks. Format the double quote marks in an interesting font that has an attractive shape for the quotes so that you create an interesting effect.
Labels: breakout box, pull quote, text box, textbox, Word 2003, Word 2007
Wednesday, April 8th, 2009
Accessing the Clipboard contents in Word 2007
In previous incantations of Word it was fairly easy to see, and therefore to know, that the Office clipboard contains more than just the most recently copied or cut item. In Word 2007 this is not the case and you need to know where the clipboard is and to understand that it contains much more of your document history than you might think it does.
How it works is that it retains everything you copy and cut to the clipboard during the current session. As you copy or cut something, all the other items are moved further down the stack leaving the current item at the top. This is the item that is pasted in if you choose the Paste option. However, you can paste anything that is on the clipboard, provided you can find it.
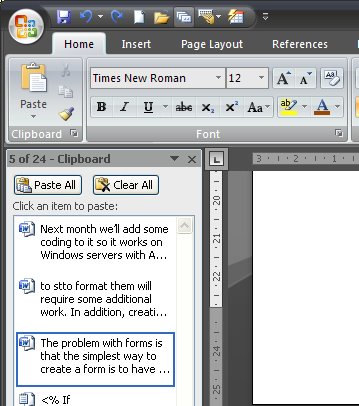
In Word 2007 click the Home tab and, below the Paste button you will see a small entry for the Clipboard and a flyout indicator. Click it and the clipboard will appear and all the items in it will be listed. The clipboard stores up to 24 items and as each additional one is added the one at the bottom is lost. You can paste any of the items that display in the list into your document by just clicking on it.
So, next time you know you cut or copied something a while ago and you need it back, check the Clipboard, chances are it’s there waiting.
Monday, April 6th, 2009
Excel – calculating workdays with Networkdays
Excel has lots of very cool functions for doing all sorts of calculations. One of these is the NETWORKDAYS function.
You can use it to calculate the number of days between two dates taking into account holidays.
Start by placing the dates for the holidays in a range of cells across a row or down a column. Select this range and name it holidays using Insert > Name > Define.
The function calculates the number of workdays between two dates so place one, for now, in cell A1 and the other in A2. This function will calculate the days between the dates in cells A1 and A2 taking into account the holidays listed in the range called Holidays:
=NETWORKDAYS(A1,A2,Holidays)
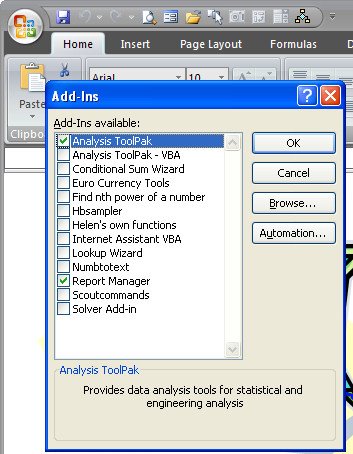
If the NETWORKDAYS function returns an error make sure that you have the Analysis Toolpak installed as this function is stored in this toolpak. To install it in Excel 2003 choose Tools > Add-ins and enable its checkbox. In Excel 2007, click the Microsoft Office Button > Excel Options > Add-Ins and from the Manage list choose Excel Add-ins and click Go. In the Add-Ins Available list enable the Analysis ToolPak checkbox and click OK.
Labels: analysis toolpak, date functions, Excel 2003, Excel 2007, holidays, NETWORKDAYS
Friday, April 3rd, 2009
PowerPoint – Create a Custom Show
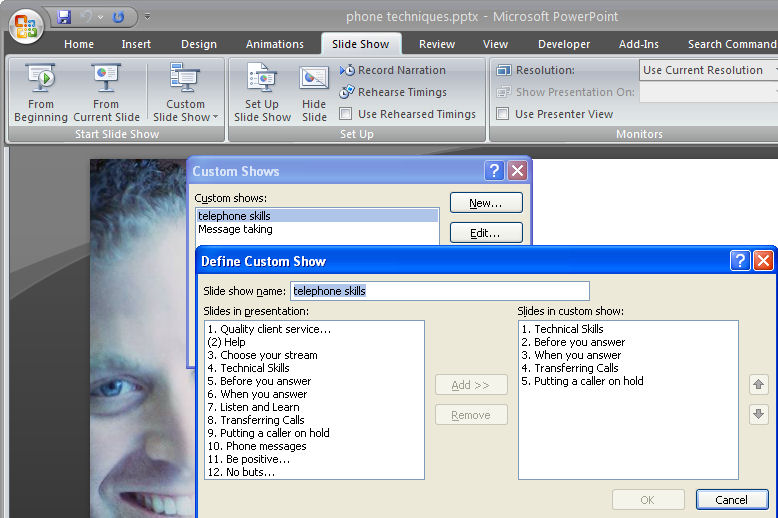
Did you know that one PowerPoint presentation can be reused over and over again, in different configurations for all sorts of purposes. A large presentation can be broken up into shorter presentations and a regular presesntation can be reworked to be used as a Kiosk presentation at a tradeshow. You can do all this without creating additional files or duplicating slides which means that you can make changes to all the shows in one step.
Create the new show
1 To create a new custom show from an existing presentation, open the presentation and, in PowerPoint 2003, choose Slideshow > Custom Shows and in PowerPowerPoint 2007 click the Slide Show tab > Custom Slide Show. Click the New button and type a name for your custom show – use a name that identifies what it contains or the audience you will present it to.
Add the slides
2 From the Slides In Presentation list click each slide that you want to include in the shortened or custom slideshow and click Add to add it to the slides in custom show dialog.
Organise the slides
3 Use the arrow buttons by the Slides In Custom Show pane to rearrange the slides to a different arrangement in the custom show if desired. When you are done, click Ok to create your custom show.
Selecting a custom show
4 If you click Close you’ll be returned to your original presentation but you can select the custom show at any time by choosing Slideshow > Custom Shows, select the custom show by name and click Show. Now if you run the slide show you’ll see the slides in the selected custom show only and in the desired order.
Customising the show
5 To customize the setup for your custom show, choose Slide Show > Set Up Show. Select the Custom Show option in the Show Slides area and click your show name in the dropdown list. Select whether the show will be given by a speaker, at a kiosk, or browsed by an individual and then set the show options. Click Ok to confirm your choice.
Things to watch out for
There are a couple things to be aware of when you are using custom shows. If you have the custom show selected, while you can still work on other slides – even those not in the custom show – if you choose to view the show you’ll see only slides in the custom show and not necessarily those you’ve been working on.
To view the entire show, choose Slide Show > Set Up Show (in PowerPoint 2007 choose Slide Show > Set Up Slide Show), and select All from the Show Slides list. Now when you run your presentation you’ll see all the slides in your presentation.
Labels: custom show, PowerPoint 2003, PowerPoint 2007
Saturday, March 21st, 2009
Better Hash Tags with Tagal.us
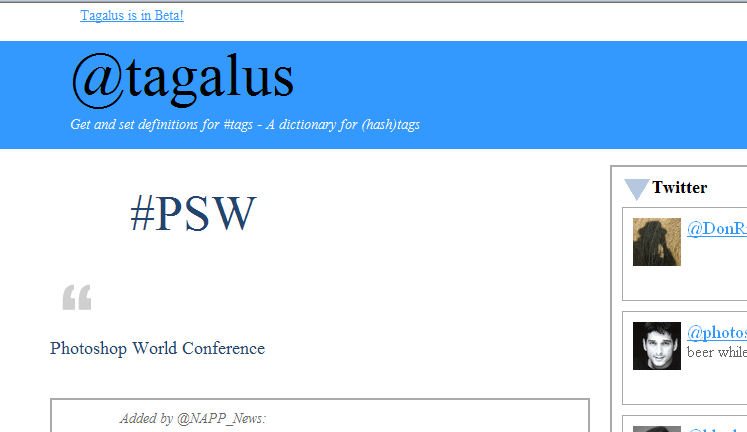
While hash tags have been around on Twitter for ages (at least ages in Twitter time!), they’re a little bit difficult to manage. Hash tags are like this #psw and they’re used as a way to tag a post with its contents. This one, #psw is for Photoshop World – using this in our Tweets lets us share messages during the conference. Problem is to find the hashtag tweets. You can do it in Twitter search but it’s cumbersome to say the least.
Enter Tagal.us which gives you an interface for setting up hash tags and monitoring the tag content. The idea is that someone registers a tag at Tagal.us for an upcoming event. So there’s already one #PSW set up for Photoshop World. Once the hash tag has been created anyone can go to the Tagal.us site using the tag as part of the URL, for example http://tagal.us/tag/psw and view the tweets that mention this tag.
Even if you’re not following someone you’ll still see them in the list and see their tweets. This is a great way to monitor activity at a tradeshow or other event where there is lots of activity in a short period of time. You can find everything relating to the hash tag you’re interested in at one easy to find (and bookmark) location.
Labels: hash tag, tagal.us, Tagalus, tweets., Twitter, Twitter tips
Sunday, March 15th, 2009
Calculating printer costs
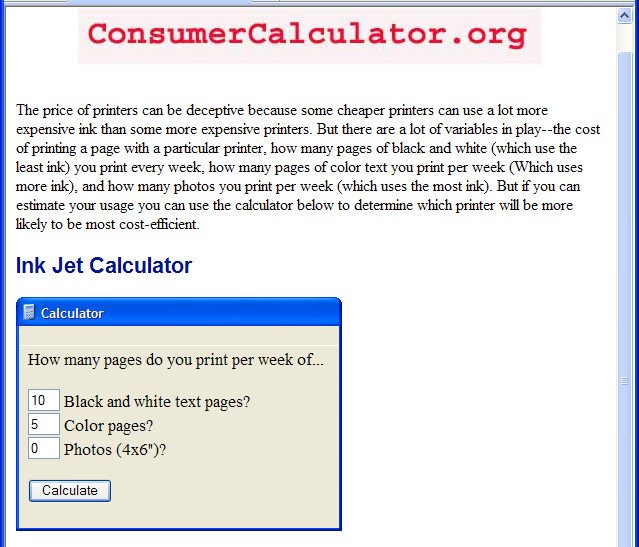
If you own an inkjet printer it won’t be long before you realise that the cost of the printer is far less than the cost of consumables for it.
I have a great HP printer which has separate colour cartridges for 5 colours and black so I only change cartridges when I run out of a colour – it’s more cost effective than replacing a composite cartridge which has multiple inks in it because you only replace a colour when you’re out of it.
However, I’m always curious about what ink costs and how much my printer really costs to run. I found, courtesy of OfficeWatch.com this calculator from the American Consumer site which helps you calculate what your printer costs. You type in how many pages in black and white, colour and photos you print a week and it calculates the cost of your printer over 3, 5 and 7 years. It’s an eye opener!
Saturday, March 14th, 2009
Solving printing problems in Excel
I’ve seen adults brought almost to tears over printing worksheets. Big worksheets consume lots of paper and when things go wrong they do so in a spectacularly wasteful way. Sometimes the best you can do is hit the printer Off switch to at least achieve a short term solution to the problem. A longer term solution is to understand how you can control what is printed and that’s what I’ll cover this month. I’ll look at the basics of printing a worksheet and then explore some more advanced options which offer better control over your printouts.
Troubleshooting problems
When you choose File > Print or click the Print button in Excel, the program determines what to print and does so. By default it prints everything on the currently active sheet. So, if you have a small set of data in the top corner of the worksheet and have accidentally typed something into a cell way below this (even if it is just a single space), you’ll get your data and everything else between this and the one cell with the mistaken entry printed. It could be pages and pages of blank paper – or lined paper if you have gridlines enabled and it’s perilously hard to track what went wrong.
You can see ahead of time that you’re about to have problems if you use the Print Preview tool. When the Next button is visible there are more pages to print than the one you can see. Of course, you should take care to never place a space in a cell. If you need to remove the cell’s contents, click in the cell and press Delete never use the spacebar.
If you can’t find the problem cell to delete it, you can try to fix the problem by deleting all the rows below your data and all the columns to the right of it and try again. In the long term this will avoid the problem happening when you print the workbook again next time. If this is a one off worksheet, you can select the area to print before printing it. Drag over the area to print and choose File > Print (don’t click the Print button on the toolbar as it prints the entire sheet regardless of what is selected). When the Print dialog appears, click Selection so only the selection will be printed.
Adding Page Breaks
To preview the page breaks on the worksheet to see where the data will be broken up into individual pages, choose View > Page Break View. Lines will appear on the screen indicating where the page breaks are. You can change these by adding your own manual page breaks but you have to do this inside the current page breaks – for example you can add a break inside a page but you can’t configure a page to be longer or wider using this method.
To add a manual page break, click to select the entire column or row where the break should appear and choose Insert > Page Break – the page break will be added to the immediate left of this column or immediately above the row. You can also click a cell and choose Insert > Page Break and a page break will be added above and to the left of that cell. When in Page Break View, not only are page breaks visible on the screen, you can also move them by dragging on them with your mouse.
Headings on all worksheet pages
Another issue when printing is that as soon as a sheet prints on more than one sheet of paper, the column headings or row headings appear on the first page but won’t appear on the other pages. This makes the data on the second and subsequent pages almost impossible to understand unless they’re taped together to form a single large sheet.
To avoid this, configure Excel to print column and row headings on every page of your printout. Choose File > Page Setup > Sheet tab and click in the ‘Rows to repeat at top’ box – type the row letters in the form $1:$1 (to print only the first row) or $1:$2 for the second etc.. If preferred, you can click the Collapse Dialog button to hide the dialog while you select the rows to use. Likewise you can set the columns that contain the row titles – generally these are in column A and you specify it in the ‘Columns to repeat at left’ box with an entry like $A:$A to use just the first column or $A:$B for the first two, etc..
More printing controls
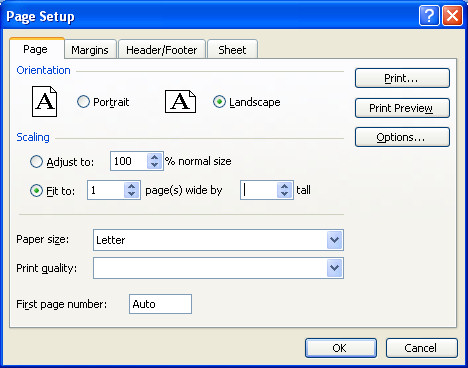
When printing a worksheet that is wider than it is tall, you can print onto paper in landscape orientation to take advantage of the dimensions of the paper. To do this, choose File > Page Setup > Page tab and select Landscape. At the same time, make sure you’ve selected Letter or A4 paper depending on what you’re using as each has different dimensions.
Shrink to fit
When you have a worksheet that is just too large to print on a single piece of paper you can shrink it to fit on a single sheet by choosing File > Page Setup > Print tab and click the ‘Fit to 1 page(s) wide by 1 page tall’ option and it will be reduced to fit on a single sheet.
If your data is very long and you want to print it one page wide but on many pages long you can use the same option – in this case set it so it reads ‘Fit to 1 page(s) wide’ and delete the entry in the second box – Excel will constrain the width to a single page but print on as many sheets as are needed length-wise.
The same can be done for a worksheet that is wider than it is tall – remove the entry from the first box so it reads ‘Fit to
When a worksheet will print over multiple sheets in both directions the order in which the sheets are printed may be important. You have two choices – you can have Excel print down the left side of the worksheet first and then across to the next series of pages to the right or you can have it print the width of the worksheet first then the pages below this. This order can be controlled using File > Page Setup > Sheet tab – and select either ‘Down, then over’ (the default) or ‘Over, then down’.
Labels: Excel 2003, Headings, page breaks, print to fit, printing, worksheet printing